Debugging Hard Faults on Cortex-M, Step by Step
By Indeep Sidhu · Nov 13, 2026
The board runs for twenty minutes, then stops responding. You attach a debugger, hit pause, and the program counter sits inside HardFault_Handler, the default while (1) {} loop from the startup file. The registers you see belong to the handler, not to the code that crashed. The evidence of what went wrong is still on the stack and in a few system registers, but you have to go and get it.
This post is a checklist for doing exactly that on Cortex-M3, M4, M7 and M33-class parts. It ends with a handler you can paste into a project.
Step 0: Make the core tell you more than "HardFault"
On ARMv7-M cores, usage faults, bus faults and memory management faults are disabled out of the box. When one of them occurs it escalates to HardFault, and you lose the specific cause. The enable bits live in SHCSR at 0xE000ED24:
MEMFAULTENA, bit 16BUSFAULTENA, bit 17USGFAULTENA, bit 18
Set all three early in main(). Once they are on, each fault lands in its own handler, and the cause is recorded in CFSR either way. I point the dedicated handlers at the same code as HardFault, so there is one place to look.
Two more switches are worth flipping. In CCR at 0xE000ED14, DIV_0_TRP (bit 4) makes integer divide by zero a usage fault instead of silently returning zero, and UNALIGN_TRP (bit 3) traps unaligned accesses. Both are off at reset. Turn the divide trap on permanently. A silent zero is a worse bug than a loud one.
#define SCB_SHCSR (*(volatile uint32_t *)0xE000ED24u)
#define SCB_CCR   (*(volatile uint32_t *)0xE000ED14u)

static void enable_fault_handlers(void)
{
    SCB_SHCSR |= (1u << 16) | (1u << 17) | (1u << 18); /* MEM, BUS, USG */
    SCB_CCR   |= (1u << 4);                            /* DIV_0_TRP */
}
If you use CMSIS, the same bits are named SCB_SHCSR_MEMFAULTENA_Msk and friends in core_cm4.h, which is where I confirmed the bit positions in this post (CMSIS core_cm4.h).
Step 1: Find the stack the faulting code was using
On exception entry the hardware pushes eight words onto the active stack and loads a special value, EXC_RETURN, into LR. Bit 2 of that value tells you which stack pointer was in use: clear means MSP, set means PSP. With an RTOS, task code runs on PSP, so you will usually need PSP. Without one, MSP is typical, but check rather than assume.
The pushed frame is, from the lowest address up: R0, R1, R2, R3, R12, LR, PC, xPSR. If the FPU was in use you get an extended frame, but those same eight words still come first.
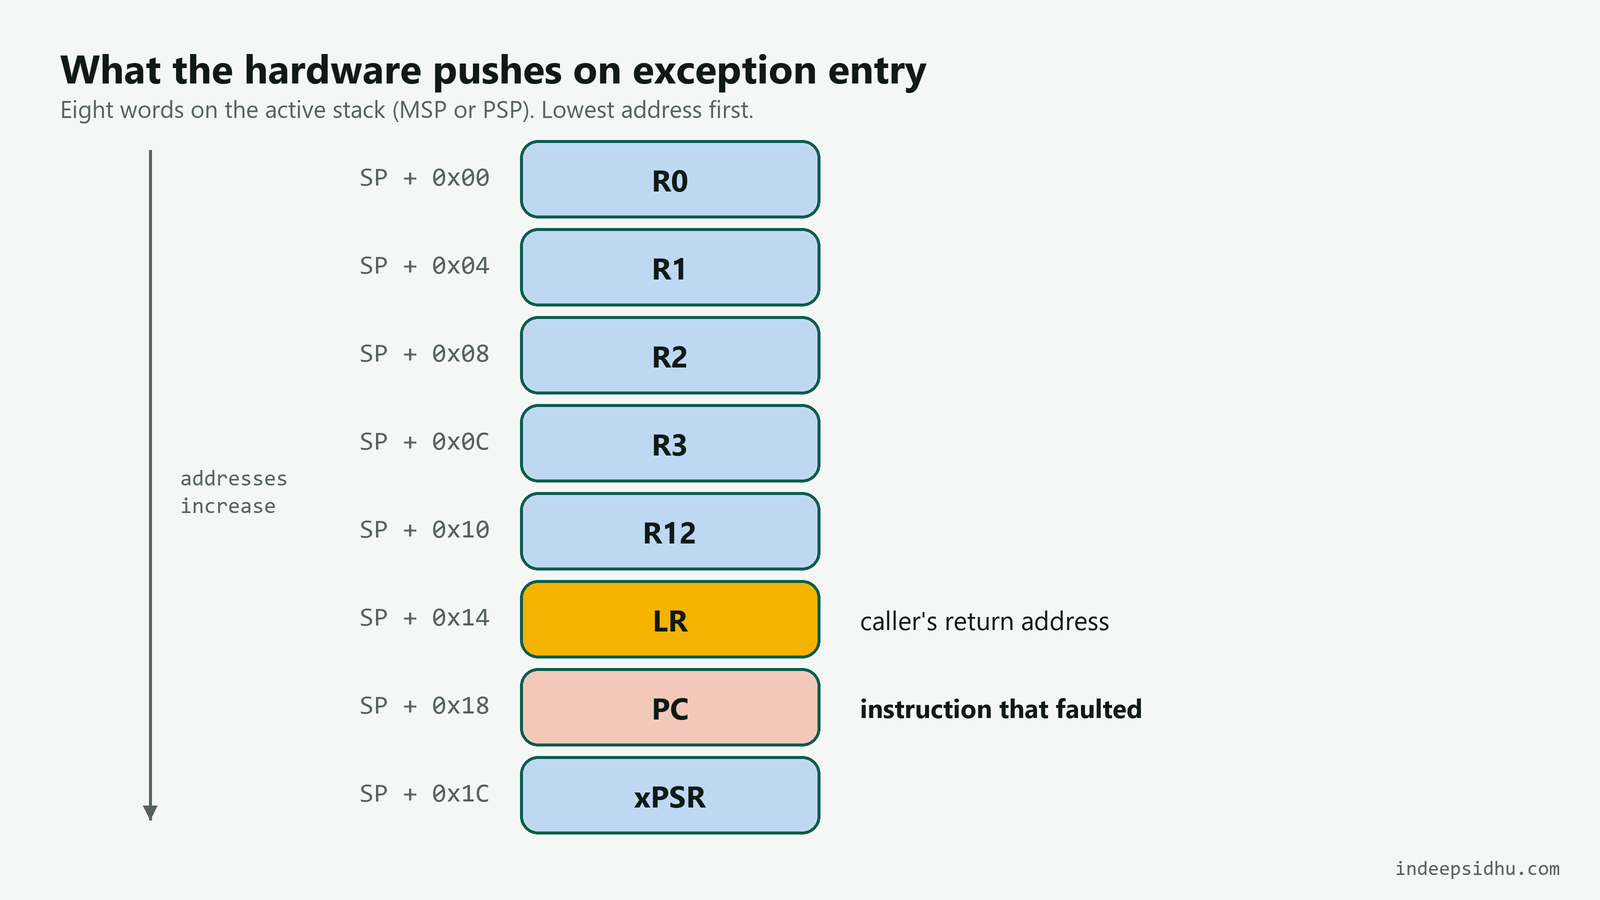
The stacked PC is the address of the instruction that faulted (for precise faults) and the stacked LR is the caller's return address. Those two values are what you came for.
Step 2: Write a handler that captures the frame
The compiler must not touch the stack before you read it. A small naked trampoline picks the stack, then calls a C function with the frame pointer. This version uses GCC syntax for Thumb-2 parts.
#include <stdint.h>

#define SCB_CFSR  (*(volatile uint32_t *)0xE000ED28u)
#define SCB_HFSR  (*(volatile uint32_t *)0xE000ED2Cu)
#define SCB_MMFAR (*(volatile uint32_t *)0xE000ED34u)
#define SCB_BFAR  (*(volatile uint32_t *)0xE000ED38u)

typedef struct {
    uint32_t r0, r1, r2, r3, r12, lr, pc, xpsr;
} stacked_frame_t;

volatile uint32_t g_cfsr, g_hfsr, g_mmfar, g_bfar;
volatile stacked_frame_t g_frame;

void hardfault_c(const stacked_frame_t *f)
{
    g_frame = *f;
    g_cfsr  = SCB_CFSR;
    g_hfsr  = SCB_HFSR;
    g_mmfar = SCB_MMFAR;
    g_bfar  = SCB_BFAR;

    while (1) { }                 /* set a breakpoint here while debugging */
}

__attribute__((naked)) void HardFault_Handler(void)
{
    __asm volatile (
        "tst   lr, #4        \n"  /* EXC_RETURN bit 2: 0 = MSP, 1 = PSP */
        "ite   eq            \n"
        "mrseq r0, msp       \n"
        "mrsne r0, psp       \n"
        "b     hardfault_c   \n"
    );
}
Copying everything into globals means you can read it in the debugger even if you pause somewhere else. You can also write the same values to a reserved RAM region or flash log and reboot. A field device will not have a debugger attached, so that second option matters more than parking in a loop.
Step 3: Decode CFSR
CFSR at 0xE000ED28 is one 32-bit register made of three parts. MMFSR is bits 7:0, BFSR is bits 15:8, UFSR is bits 31:16. Bits are sticky: they stay set until you write 1 to them, so clear them after logging or the next fault will confuse you.
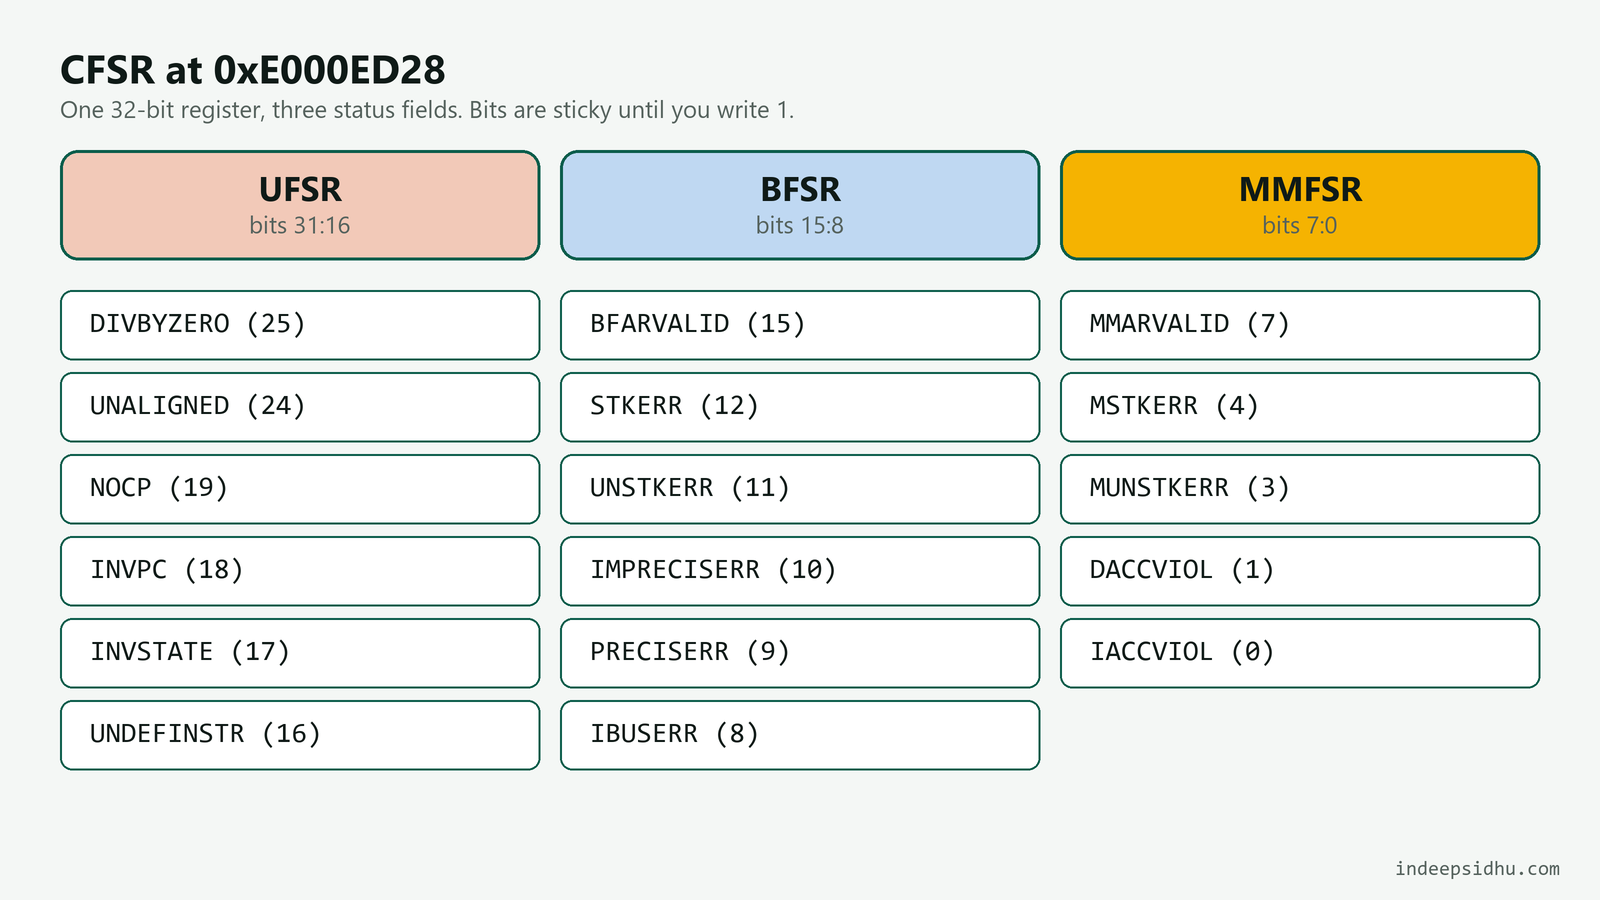
These are the bits I look at first:
- Bit 0,
IACCVIOL: Instruction fetch blocked by the MPU or an XN region - Bit 1,
DACCVIOL: Data access blocked by the MPU - Bit 7,
MMARVALID: MMFAR holds the faulting address - Bit 8,
IBUSERR: Bus error on instruction fetch - Bit 9,
PRECISERR: Precise data bus error, stacked PC points at the cause - Bit 10,
IMPRECISERR: Imprecise data bus error, PC may be later than the cause - Bit 11,
UNSTKERR: Bus fault while unstacking on exception return - Bit 12,
STKERR: Bus fault while stacking on exception entry - Bit 15,
BFARVALID: BFAR holds the faulting address - Bit 16,
UNDEFINSTR: Undefined instruction executed - Bit 17,
INVSTATE: Invalid execution state, often a function pointer without the Thumb bit - Bit 18,
INVPC: Bad EXC_RETURN or bad PC load on return - Bit 19,
NOCP: Coprocessor access, for example the FPU not enabled - Bit 24,
UNALIGNED: Unaligned access, only trapped whenUNALIGN_TRPis set - Bit 25,
DIVBYZERO: Divide by zero, only trapped whenDIV_0_TRPis set
HFSR at 0xE000ED2C adds three more. FORCED (bit 30) means a configurable fault escalated, so the real cause is in CFSR. VECTTBL (bit 1) means a bus fault while reading the vector table. DEBUGEVT (bit 31) is a debug event with debug disabled.
MMFAR (0xE000ED34) and BFAR (0xE000ED38) are only meaningful when MMARVALID or BFARVALID is set. Otherwise they hold stale data, so do not trust them blindly.
Step 4: Turn the bits into a cause
A few common patterns, as examples of how I read them:
- PRECISERR with BFARVALID. BFAR is the bad address, and the stacked PC is the instruction that did the access. A BFAR near zero usually means a null pointer dereference through a struct member. A BFAR in a peripheral range can mean the peripheral clock was not enabled.
- IMPRECISERR. The write was buffered, so the fault arrived after the processor had moved on. On Cortex-M3 and M4 you can set
DISDEFWBUF(bit 1) in ACTLR at0xE000E008to turn off write buffering while debugging. That makes the faults precise and costs some speed. - INVSTATE. Look at the stacked PC and the pointer that was called. A function pointer with bit 0 clear is the usual suspect.
- STKERR or MSTKERR. The stack pointer itself is invalid. A stack overflow into unmapped or protected memory ends up here. The stacked frame may be unreliable, so check SP against your stack bounds first.
- UNDEFINSTR. Jumped into data, or compiled for an FPU the core does not have.
- NOCP. An FPU instruction ran before CPACR enabled the FPU.
Step 5: Map the address back to source
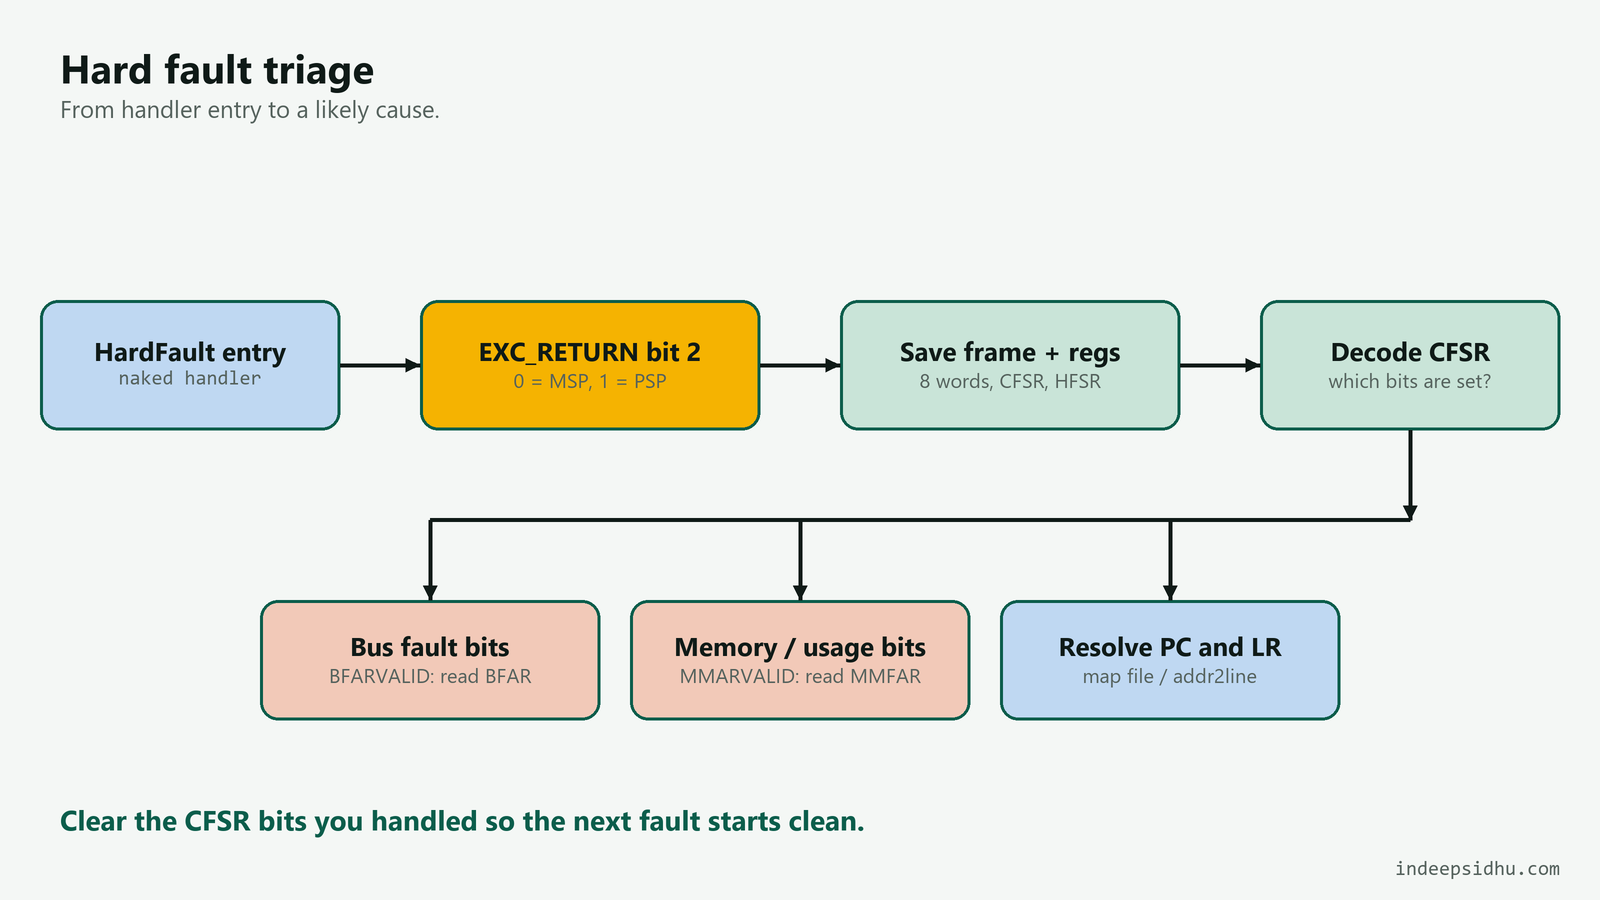
Take the stacked PC and look it up in the map file or with arm-none-eabi-addr2line -f -e firmware.elf 0x08001234, where the address is whatever you captured. Then look at the stacked LR for the caller. If PC is garbage, the stack or a function pointer was corrupted, and LR is not much better. In that case, read the memory around the saved SP and look for return addresses that resolve to real functions.
Cortex-M0 and M0+
These cores have no CFSR, HFSR, MMFAR or BFAR. Every fault is a HardFault. You still get the same stacked frame and the same EXC_RETURN choice of stack, so Steps 1 and 2 apply, minus the register reads. You lose the decoding. Work from the stacked PC and ask what that instruction was doing: an unaligned access, a load from an invalid address, or an undefined opcode. Memfault's write-up covers the differences between cores in more detail (Memfault: debugging a HardFault).
The checklist
- Enable MEMFAULTENA, BUSFAULTENA and USGFAULTENA in SHCSR.
- Enable
DIV_0_TRP, andUNALIGN_TRPif your code should never do unaligned access. - Use a naked handler that tests EXC_RETURN bit 2 and picks MSP or PSP.
- Save the eight stacked words, CFSR, HFSR, MMFAR and BFAR before doing anything else.
- Check MMARVALID and BFARVALID before using the address registers.
- If IMPRECISERR is set, retry with write buffering disabled.
- Resolve the stacked PC and LR against the ELF file.
- Write 1 to the CFSR bits you handled so the next fault starts clean.
- On Cortex-M0, rely on the stacked frame alone.
Takeaway
Do not wait for the first field crash to write this handler. Put the naked trampoline, the SHCSR setup and a small RAM log of the stacked frame and CFSR into every firmware project from day one, and check the log during boot. A fault you can read at the next reset takes minutes to fix. A fault that leaves only a spinning loop can take days.